
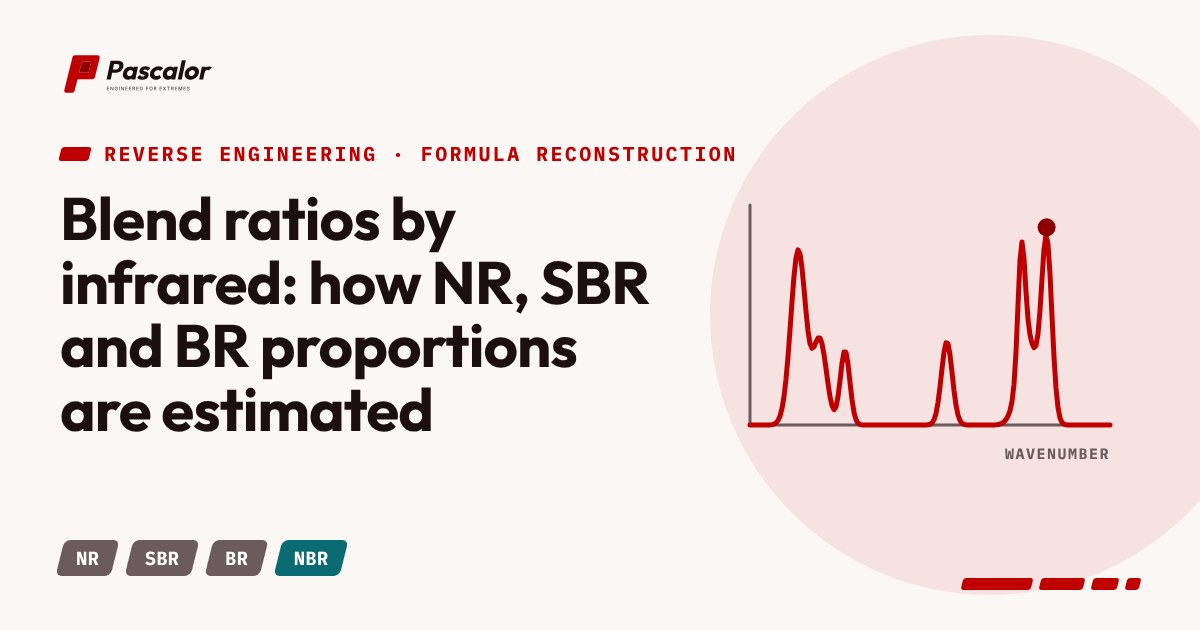
Tyre treads, belts, rolls, motor mounts and many general-purpose compounds are blends of two or three polymers. Knowing the family is not enough. The proportions change grip, wear, heat build-up and low-temperature behaviour.
The idea
Each polymer has IR bands that are strong and unique. If you prepare standard blends of known ratio, measure the same band-intensity ratio in each, and plot the ratio against composition, you have a calibration curve. An unknown sample's ratio is then read off the curve.
Typical pairs
- SBR with BR. Use the butadiene bands (around 966, 911 and 740 cm⁻¹) against the styrene bands (around 700 and 760 cm⁻¹). Styrene content of the SBR itself must be known or estimated.
- NR with BR. Use the natural rubber band near 835 cm⁻¹ against the butadiene bands.
- NBR with other rubbers. Nitrile is easy to quantify through the C≡N band, but the acrylonitrile content of the NBR must also be established to convert to rubber proportions.
- Polymer blends with thermoplastics such as PVC in NBR/PVC blends are found by chlorine analysis and thermal methods.
Practical points
- Use the extracted, black-free rubber wherever possible, or pyrolysate spectra, because carbon black distorts band heights.
- Calibrate with the same sampling technique. A calibration made on cast films cannot be used for ATR spectra of a filled part.
- Treat the answer as a range. A good IR blend ratio is rarely better than ±5 percentage points. A statement like "70 to 80 parts SBR, 20 to 30 parts BR" is more honest than "73/27".
- Cross-check with thermal analysis. DSC may show two glass transitions if the polymers are immiscible. Their positions identify the polymers and the size of each step supports the ratio.
Tying it back to the properties
If the reconstructed blend ratio gives a compound whose glass transition, hardness and abrasion resistance differ from the original, return to the ratio before changing anything else. Polymer choice is the biggest lever on low-temperature behaviour, and it is the most important variable for HPLT work.